Team Dashboard & Profile Report
Team Profile

The sections below cover 3 topics:

  1. What can the team report be used for?
  2. Some components from the Business Partner back-office Team Dashboard
  3. Some components from the Team Profile report that is generated by the system when requested by the Business Partner

What can the Team report be used for?

  • Use for New Teams.
  • Team communication improvements.
  • When teams are forming.
  • When teams have a change of members or Team focus changes to a new project.
  • Identify team Colour Saturation and colour intensities.
  • Adjust team members to fit into a relevant team or the appropriate role for the individual member.
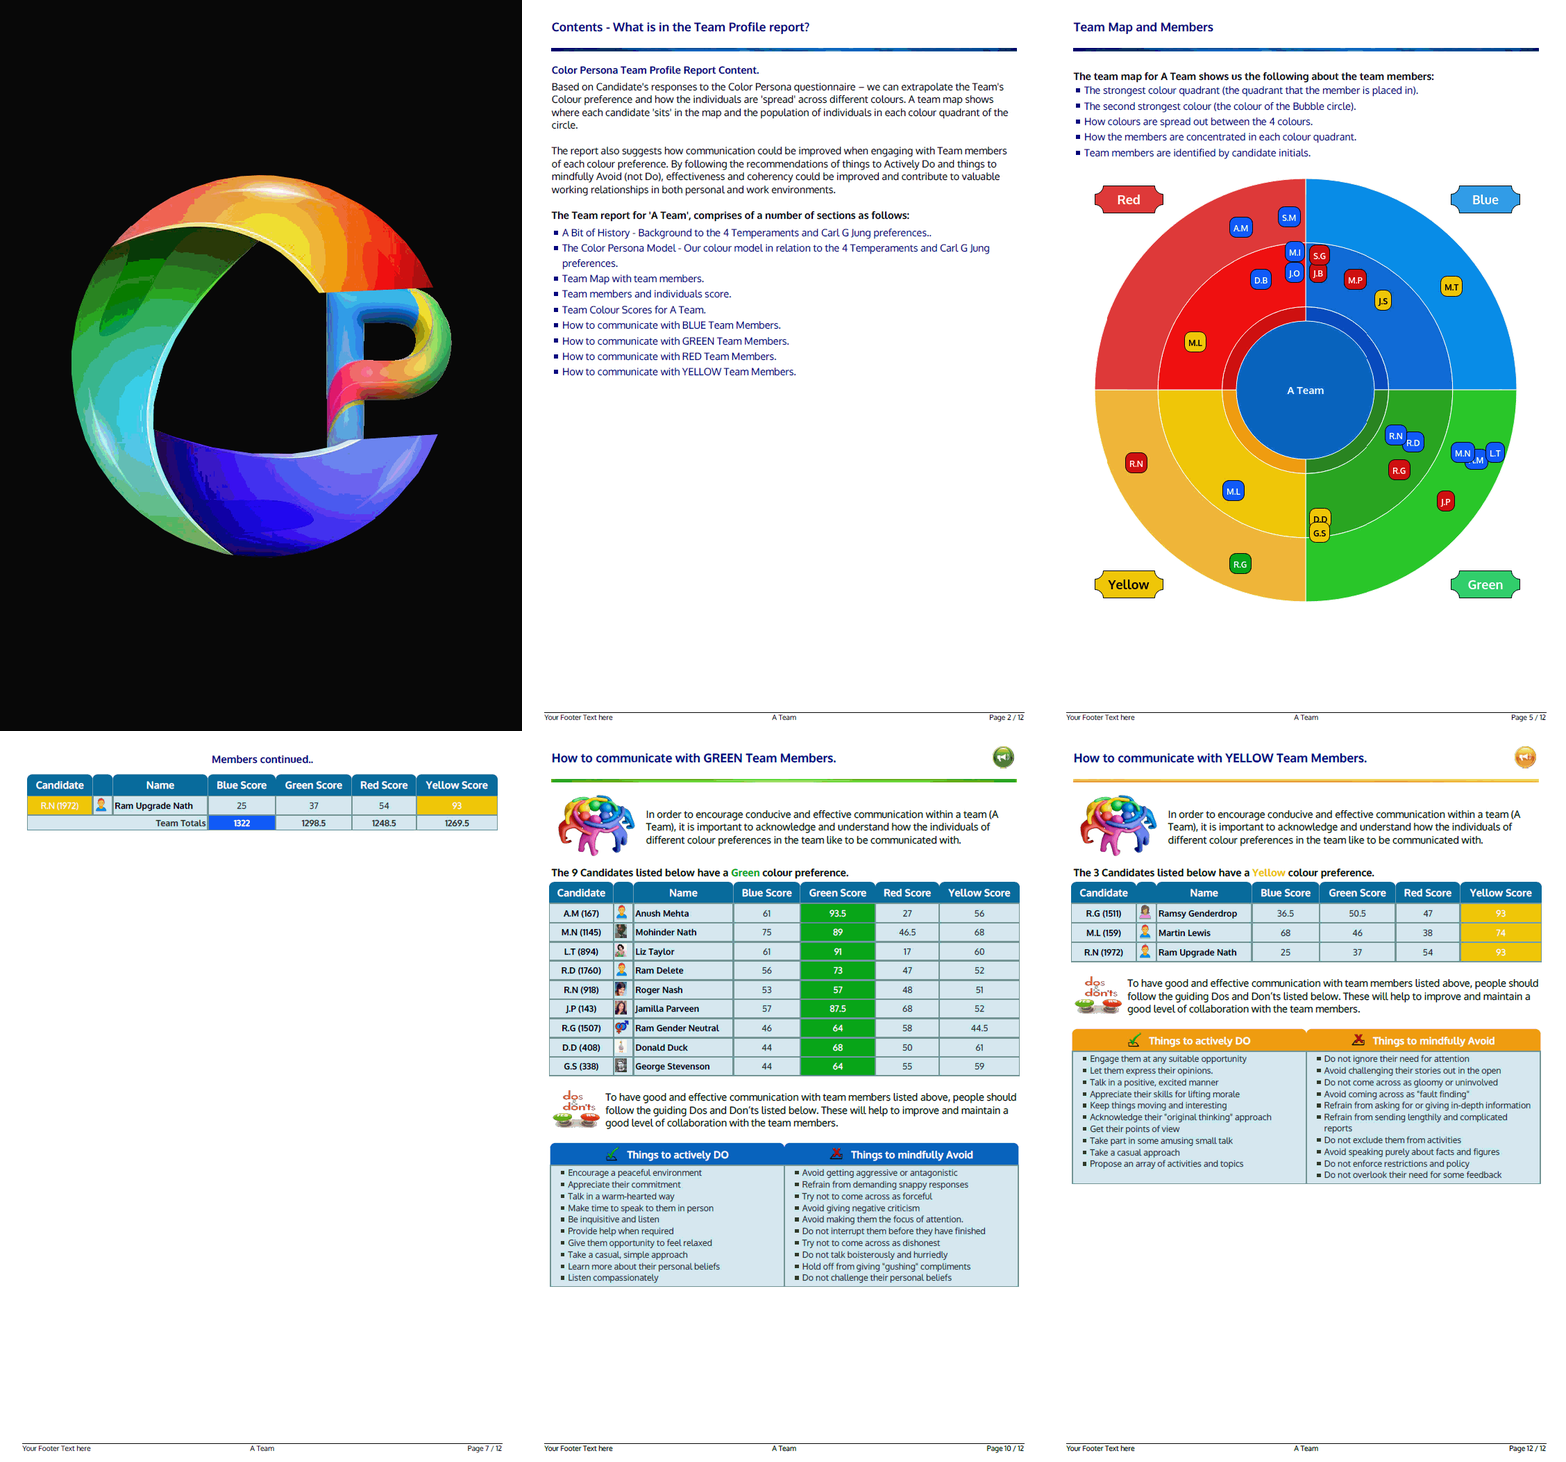
Team Profile report preview

Some back-office Team Dashboard elements:
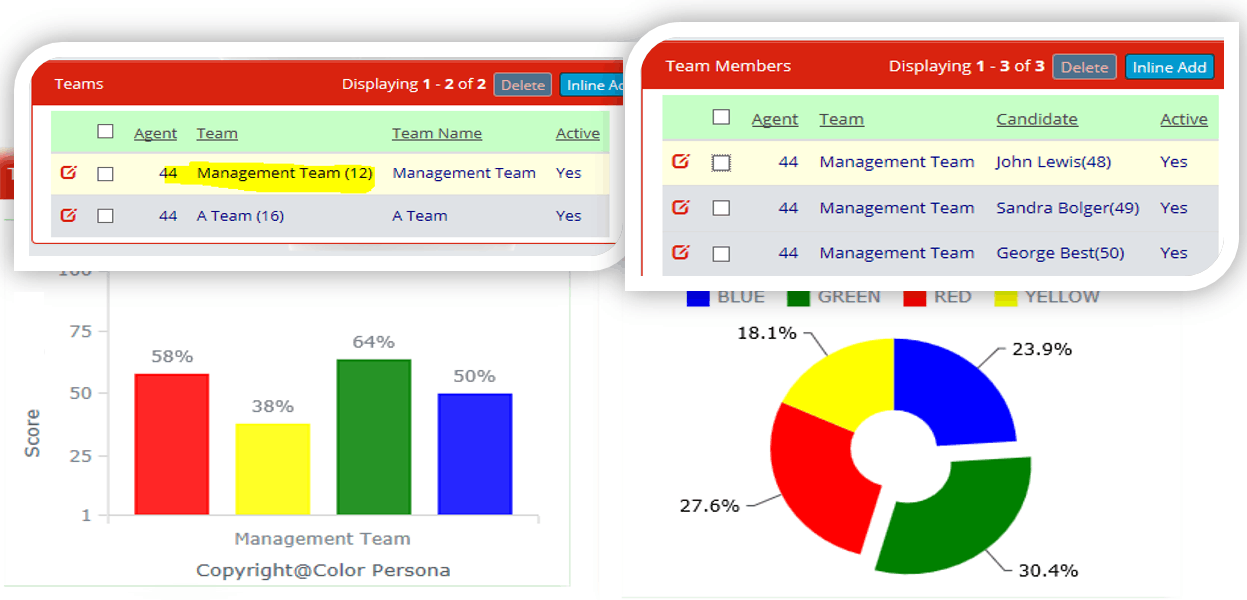
Color Persona Team
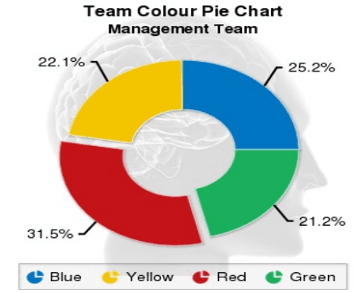
  • Note: The Bar and Pie charts will be dynamically updated on screen as Team Members are Added/activated/removed/deactivated.

About Team Profile Report

Report can be generated by a Business Partner once a number of candidates have completed the questionnaire and the Business Partner has created a team and added candidates to the team.  The report offers the following insight:

  • Team Colour strength. See where candidates are  “positioned” in the Team in relation to other members.

  • Visually compare and analyse the “lesser” colours.

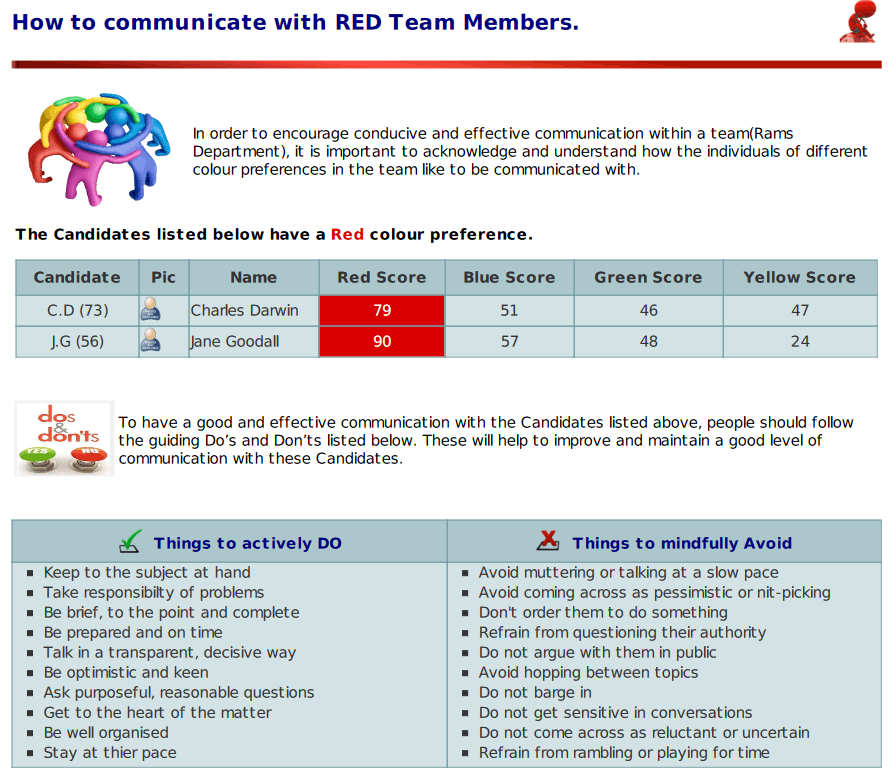
  • How a team member should communicate with other team members with different colour preferences.

  • Team Wheel which maps each team member and their correlating colour quadrant. Visually, you can see the ‘colour population’ density of the team.

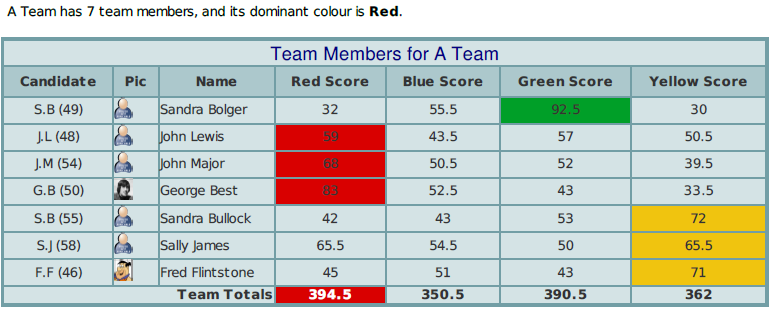
  • Team List, with members and their colour scores, as well as the total colours for each colour, and finally the ‘highest’ team colour.

Team Profile Benefits

  • Add your Business branding in profile reports and Business Partner back-office  account
  • Learn about your Team members communication style
  • Learn how to communicate with people in the team with different colour energy preferences.
  • Understand the overall team colour scores and colour strength.
  • Analyse the areas of possible team weakness using colours.
  • Visually see where individuals are positioned in Team Wheel.
  • Visually identify the colour density of candidates within each colour segment.
  • Construct hypothetical teams in th eportal until you feel it is the right mix of candidates for the intended objective of the team.
  • Use the online personify feature to enhance the team collaboration & communication. can be used from mobile devices without login by team members
  • Share & Learn the Do’s and Don’ts when communicating with diffrent groups of team members
  • A simple 4 colour system, NO association with things like air, fire, water and earth etc.
  • Easy to remember and recognise people of other colour types and associated energies.
  • Uniquely Personalised Team profile report content.
  • Personalised charts to the Team scores, illustrates and assists in understanding of the colour methodology.
  • No contract or commitment with Color Persona.
  • Candidates must have completed a Color Persona questionnaire and a profile published before they can be added to the Teams.
Team Profile

Components from the Team Profile report
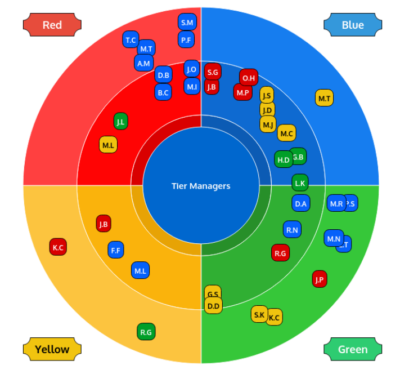
  • Candidate is placed in the prominent colour sector.

  • Candidates Initials on “bubble” identifying location in the team wheel

  • The “bubble” Colour is based on their second strongest colour.

  • List report highlights the team members and individual Colour scores.

  • Shows List of Candidates and identifier keys.

  • Shows each Candidates Highest Color (shaded).

  • Shows Total for Each Colour for the Team.

  • Highlights the Teams Highest Colour (shaded).

  • How to communicate with other Team members with Colour preference.

  • E.g.  how to communicate with team members who are Red.

  • Repeated for Blue, Green and Yellow team members.

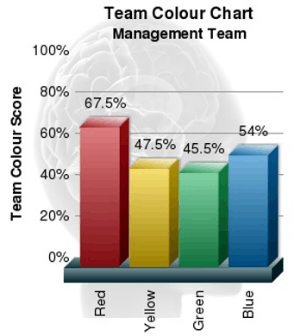
  • Aggregate colour score for Red is shown as a percentage of 100% Red.

  • Aggregate colour score for Blue is shown as a percentage of 100% Blue.

  • Aggregate colour score for Green is shown as a percentage of 100% Green.

  • Aggregate colour score for Yellow is shown as a percentage of 100% Yellow.

Team Colour Pie chart
  • Chart shows the individual colour percentages of each colour in comparison with the other colours.

  • Identifies the strongest colour in the Pie chart as ‘sliced

  • The report will break down each colour score for clarity.